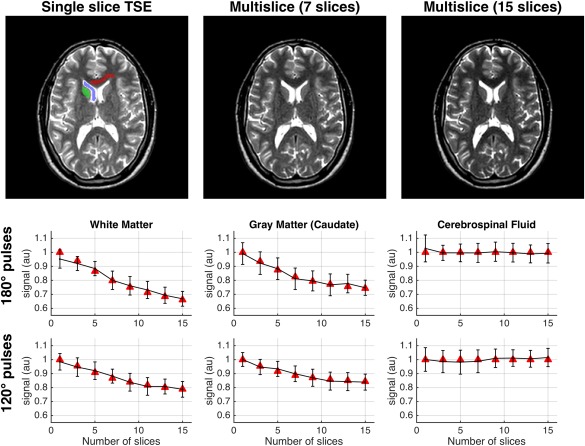
Figure 8.

Top row: Turbo spin echo (TSE) images acquired using 180° refocusing pulses with single slice versus multislice, with 7 and 15 slices. The contrast changes as the number of slices increases, with the signal from white matter clearly falling. Lower rows: Predicted signals from EPG‐X(MT) model (red triangles) compared with the measured signals (error bars) from regions of interest indicated on the first image (red = white matter, green = caudate nucleus, blue = cerebrospinal fluid) as the number of acquired slices is changed. The upper row of plots shows data for 180° refocusing pulse sequence; the lower row is for 120° refocusing pulses. The signal from white matter is strongly attenuated, particularly with the 180° pulse sequence. Caudate nucleus shows similar, but slightly less severe, attenuation. The EPG‐X(MT) predictions match the experimental data within error. As expected, cerebrospinal fluid shows no attenuation, indicating no direct slice cross‐talk.
