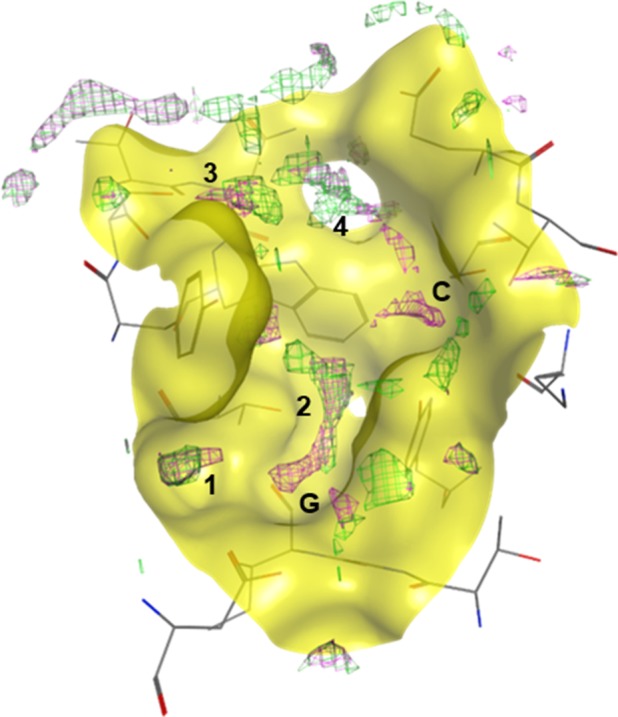
Figure 2.

Prediction model of NRP1‐b1 binding site hydration. Computational analysis performed on PDB entry 3I97, where the green mesh represents the solvation prediction with EG00229 bound to NRP1‐b1, and the pink mesh represents the solvation prediction of NRP1‐b1 in the apo form. Labels 1–4 indicate the regions predicted to be occupied by water molecules in the binding site; G and C indicate the regions occupied by the arginine guanidine and carboxylate groups, respectively, if EG000229 is bound. In the apo form of NRP1‐b1, these regions are also predicted to be occupied by water molecules.
