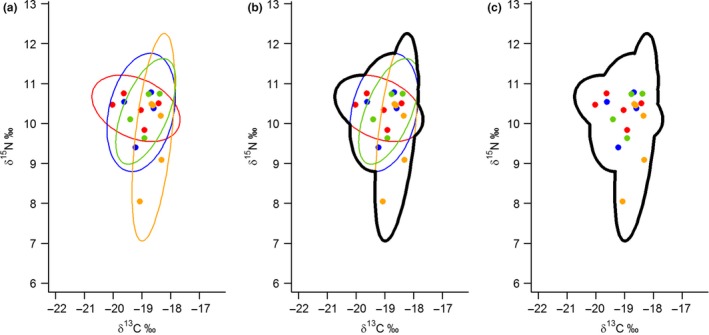
Figure 1.

Calculating the relative individual niche index (RINI) in banded mongoose groups (Mungos mungo). (a) In each group (group 21 in this example) individual 95% prediction ellipse areas, corrected for sample size (ell95c, Jackson et al. 2011) were overlaid. The outline of the area these overlaid ellipses covered was calculated (b) to create a group niche area (c) which the individual ellipse areas in (a) were expressed as a proportion of. In each plot: colours represents different individuals; points represents carbon (δ13C) and nitrogen (δ15N) isotope ratios obtained from vibrissa samples (in this example 17 samples from four individuals); thin coloured lines show individual's 95% prediction ellipses; the think black line shows the estimated group niche area.
