
Figure 4.
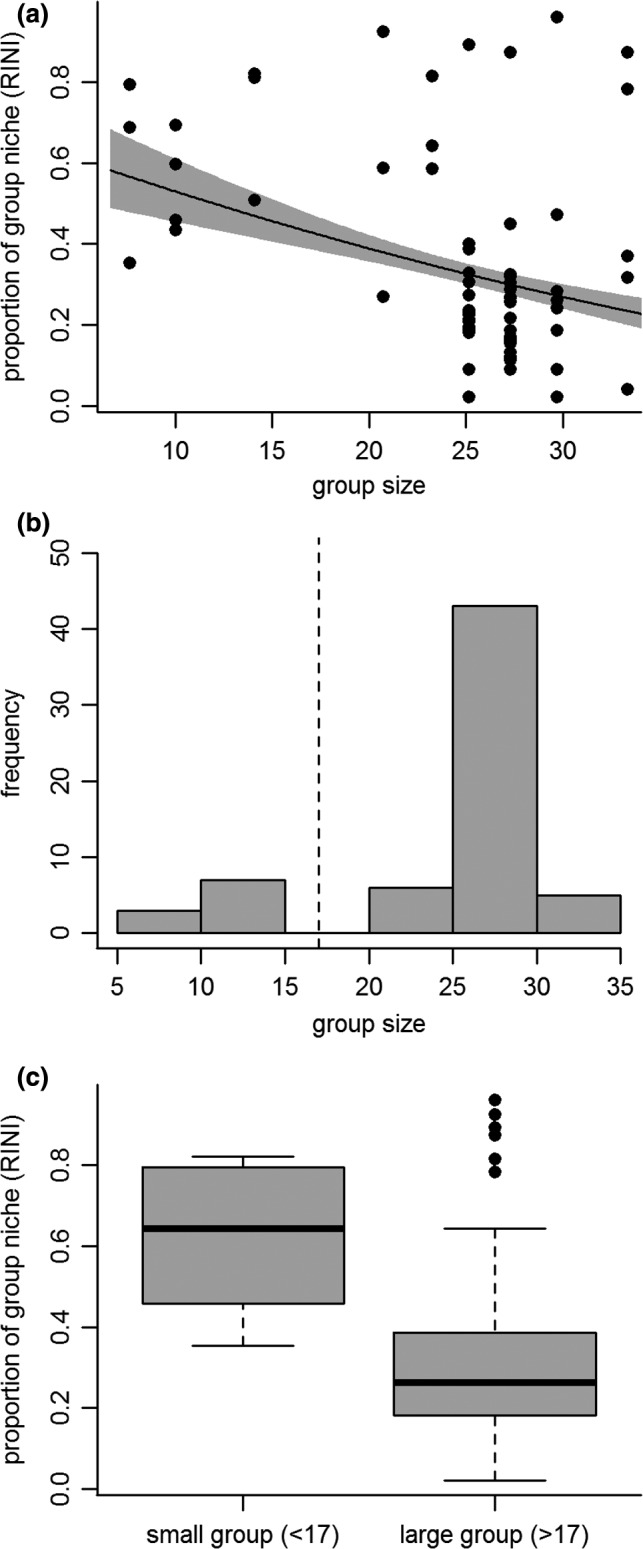
Individual banded mongooses (Mungos mungo) in larger groups have smaller foraging niches, measured as a proportion of their group's niche (RINI, see Fig. 1). Panel a shows the raw data (points; 315 samples from 64 individuals) and relationship ± SE (line and shaded area) predicted by our model with group size as a continuous variable with all other variables set at their mean. Group size data were bimodal (panel b) and so we divided our data into individuals from small and large groups (denoted by dotted line at 17 individuals in panel b) and refitted our model with group as a categorical. This also showed that individuals in larger groups occupied smaller foraging niches (panel c). The box‐and‐whisker plot in panel c shows the median (thick horizontal line), interquartile range (boxes) and 1.5 times the interquartile range (whiskers) for the data in small and large groups. The points show data that fall outside of this range.