Figure 1.

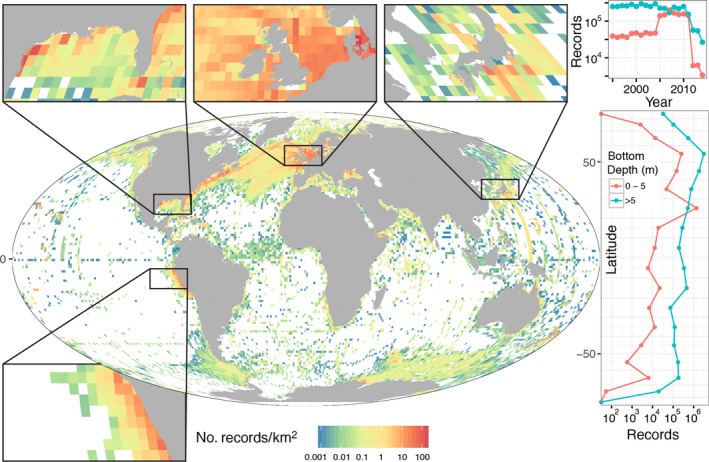
The Ocean Biogeographic Information System (OBIS 2017) is the preeminent open‐access database for international marine biodiversity assessments. This map shows the density of taxonomic records from the OBIS in 1 × 1° cells of the global ocean in near‐surface pelagic and coastal waters (upper 20 m; n = 10.8 million; Mollweide projection map of the number of records per square kilometer; color bar in log10‐scale; data extracted 3 October 2016). Nearshore records represent benthic and water column data combined in waters from 0 m to 5 m bottom depth. Pelagic records are sampled from the surface ocean (upper 20 m) starting at a bottom depth of 5 m near the coast. The four inset maps show regions around the globe with dense OBIS records, yet these also demonstrate inconsistent spatial coverage. Right‐hand graphics: The shallow pelagic records (>5 m bottom depth) generally show two to three orders of magnitude more observations than nearshore areas in most latitude bands. The sudden increase in nearshore records in the 2005–2010 timeframe is largely a contribution of observations collected in the Florida Keys region (USA). The overall decline in data after 2010 highlights typical delays in processing and reporting biological observations to OBIS. Systematic sampling by satellite remote sensing, combined with field observations, animal tracking, and modeling, promise to fill the widespread gaps in space and time and enable routine assessments of marine biodiversity in the world's coastal and pelagic zones.
