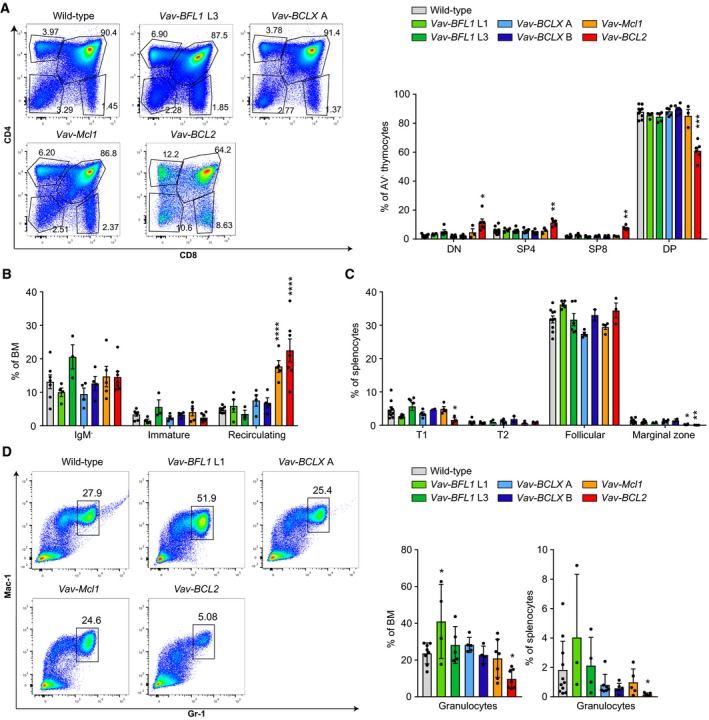
Figure 2.

Leukocyte subset composition in Vav‐BFL1 and Vav‐BCLX TG mice. (A) Representative dot‐plots of thymocytes from wild‐type, Vav‐BFL1 TG line L3, Vav‐BCLX TG line A, Vav‐Mcl1 TG and Vav‐BCL2 TG mice stained with antibodies specific for CD8 or CD4; bar graph summarizing the results (n = 3–4/genotype). (B) Flow cytometry was used to assess the distribution of B220loIgM− pro‐/pre‐B cells, B220loIgM+IgD− immature B cells, and B220hiIgM+IgD+ recirculating B cells in the bone marrow (BM). (C) Splenocytes were analysed for the presence of B220+CD23−CD21loIgM+ transitional 1 (T1) B cells, B220+CD23+CD21hiIgMhi transitional 2 (T2) B cells, B220+CD23+CD21+IgM+ follicular B cells, and B220+CD23−CD21hiIgMhi marginal zone B cells. (D) Representative dot‐plots of bone marrow from wild‐type, Vav‐BFL1, Vav‐BCLX, Vav‐Mcl1 and Vav‐BCL2 TG mice showing CD11b/Mac‐1+Gr‐1hi granulocytes. Bar graphs: quantification of the granulocytes in the bone marrow (left graph) and spleen (right graph). Statistical analysis was performed by using one‐way ANOVA with Dunnett's multiple comparison. *P < 0.05; **P < 0.01; ***P < 0.001; ****P < 0.0001; n ≥ 3 ± SD.
