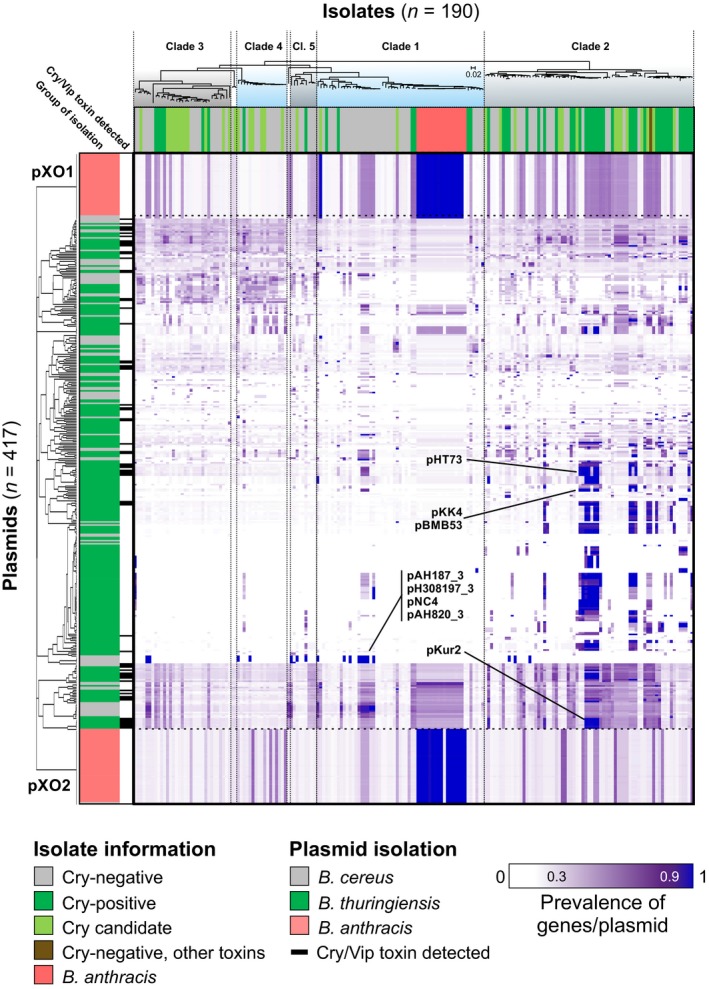
Figure 4.

Prevalence of 410 plasmids in 190 Bacillus cereus group isolates. The presence of 44,759 plasmid genes from 410 plasmid reference sequences (rows) was examined in 190 genomes (columns), and the proportion of detected plasmid genes per plasmid reference sequence was calculated for each isolate. On the heatmap, blue indicates 100% of genes from that plasmid are in the genome with progressively lighter shades of purple indicating decreasing prevalence to white (fewer than 30% of genes are detected). The source of plasmid isolations (coloured row headers) and the “species” of the bacterial genome examined (coloured column headers) are given for Bacillus anthracis (pink), Bacillus thuringiensis or Cry‐positive isolate (green), B. cereus or Cry‐negative isolate (grey). Isolates are ordered by the tree (Figure 1a), and plasmids are clustered based on gene prevalence patterns inferred by WebGimm (Joshi et al., 2011) using the context‐specific infinite mixture model (Freudenberg et al., 2010). Names on the figure indicate known plasmid names of interest [Colour figure can be viewed at http://www.wileyonlinelibrary.com/]
