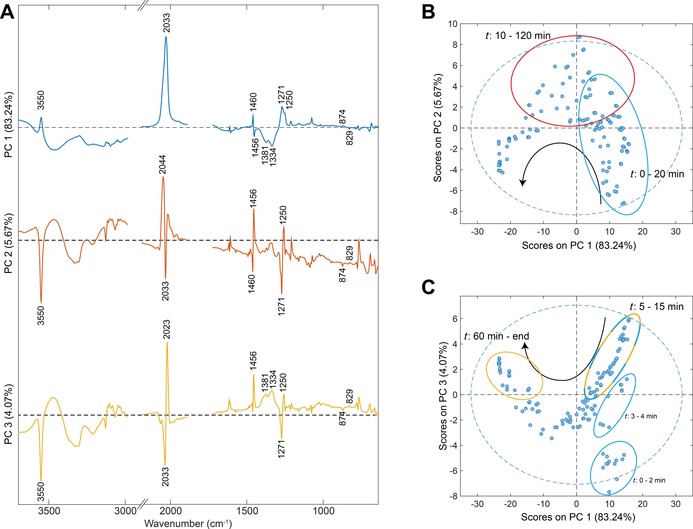
Figure 3.

PCA scores and loading plots for the photodecomposition of 1 under 420 nm irradiation by ATR‐FTIR. A) Loading plots of PC1 (blue), PC2 (red) and PC3 (yellow). Black dashed line=0, spectral regions were cut for the sake of clarity after PCA analysis. B) PC1 vs. PC2. C) PC1 vs. PC3. Black arrows indicate time trajectory in score plots, ellipse encircle specified time points and are coloured according to the positive PC score, blue dashed line=95 % confidence limit.
