Figure 4.

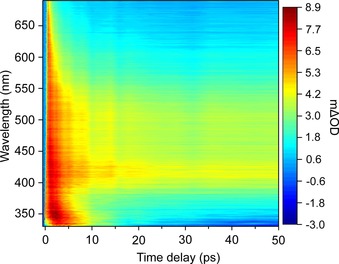
TAS of 1 in acetonitrile (2 mm) upon 310 nm excitation, displayed as a false colour map, indicating the change in optical density (mΔOD).

TAS of 1 in acetonitrile (2 mm) upon 310 nm excitation, displayed as a false colour map, indicating the change in optical density (mΔOD).