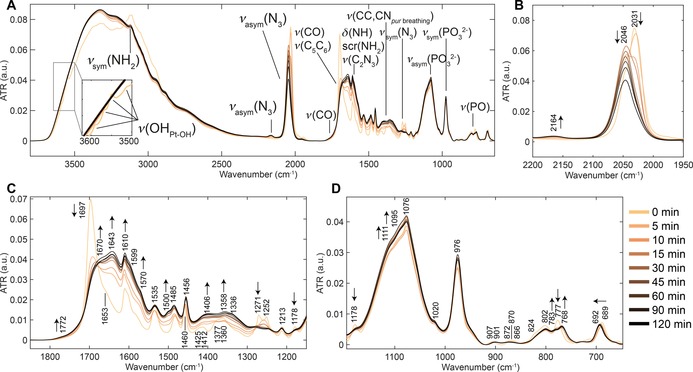
Figure 6.

ATR‐FTIR spectra of the photodecomposition of 1 (2 mm)+5′‐GMP (2 mol equiv) under 420 nm irradiation. A) Full spectral range, 3800–645 cm−1, including main peak assignments. Refer to Figure S20 in the Supporting Information for a full description of peak vibrations. B) ATR‐FTIR spectra, 2200–1950 cm−1, highlighting the decrease and shifts in ν asym(N3) at 2031 cm−1 to 2046 cm−1 and the appearance of a new peak at 2164 cm−1. C) ATR‐FTIR spectra, 1850–1150 cm−1, highlighting the decrease in ν(CO) at 1697 cm−1, ν sym(N3) at 1271 cm−1 and ν(CC,CNpyr breathing) at 1178 cm−1, as well as the increase of several (new) peaks at 1172, 1670, 1643, 1610, 1570, 1500, 1406 and 1358 cm−1. D) ATR‐FTIR spectra, 1190–640 cm−1, highlighting the increase of the broad νasym(PO3 2−) peak at 1076 cm−1 and the shift of ν(PO) from 777 cm−1 to 768 cm−1. Notations used: ν=stretch, δ=in‐plane angle bending, sym=symmetric, asym=antisymmetric, pur breathing=purine breathing mode and arrows indicate direction of change to the vibration throughout irradiation.
