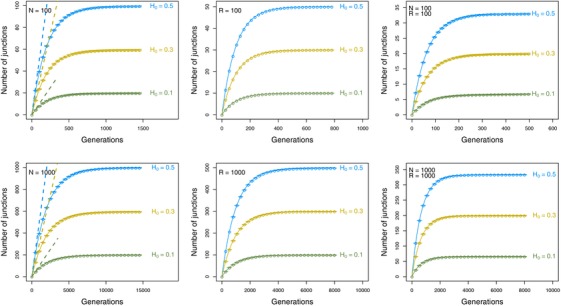
Figure 4.

Number of junctions over time for individual‐based simulations, and analytical predictions. Left column: Results assuming a chromosome with an infinite number of junction sites, , and a population size (N) of 100 or 1000 individuals (circles), the analytical prediction for an infinite population size (dashed line), or the analytical prediction for a finite population size (eq. (3)), solid line. Middle column: Results assuming a chromosome with a finite number (R) of junction sites, where R is 100 or 1000, and a population size of 100,000 (circles), or the analytical prediction according to equation (7) (solid line). Right column: Results for a chromosome with a finite number of junction sites of length R of 100 or 1000, and a finite population of size N is 100 or 1000 (circles), or the analytical prediction according to equation (11). Error bars indicate the standard error of the mean across 1000 replicates. Shown are results for different initial frequencies of heterozysity H 0. For all results shown, .
