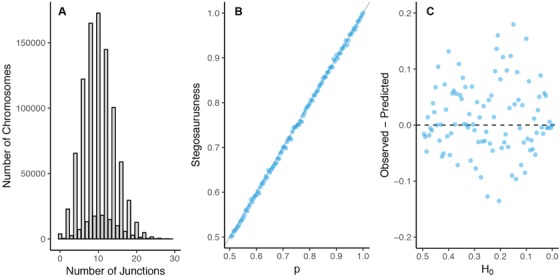
Figure 5.

(A) Example distribution of number of chromosomes with n junctions. Results are shown for , , , at . Results show the “stegosaurus” pattern, where chromosomes with an even number of junctions are more frequent than chromosomes with an odd number of junctions. (B) Linear relationship between the degree of “stegosaurusness” and the frequency of the most common ancestor in the hybrid swarm, p. Results are shown for , , at . (C) Inaccuracy in the estimate of the maximum number of blocks K, depending on the initial heterozygosity . Although the degree of stegosaurusness increases with decreasing H 0, error in the estimate of K, and overall estimate in the accumulation of junctions, does not increase. Points are the mean of 10 replicates.
