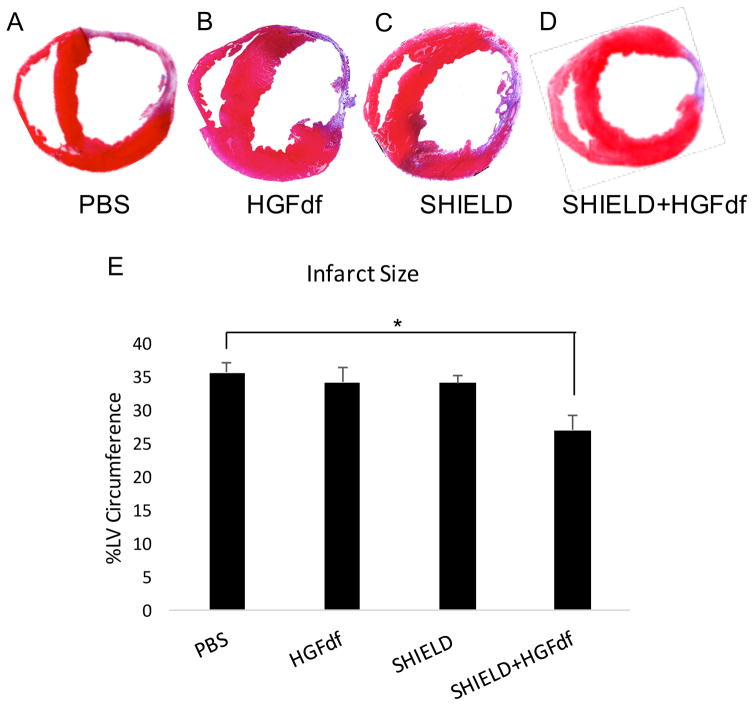
Figure 6.
Quantification of infarct size via Masson’s Trichrome staining. Shown are representative sections of Masson’s trichrome-staining for groups treated with (A) PBS, (B) HGFdf, (C) SHIELD, and (D) SHIELD+HGFdf. (D) Infarct size was calculated by transmural infarct percent circumference of the left ventricle (*p<0.05).

