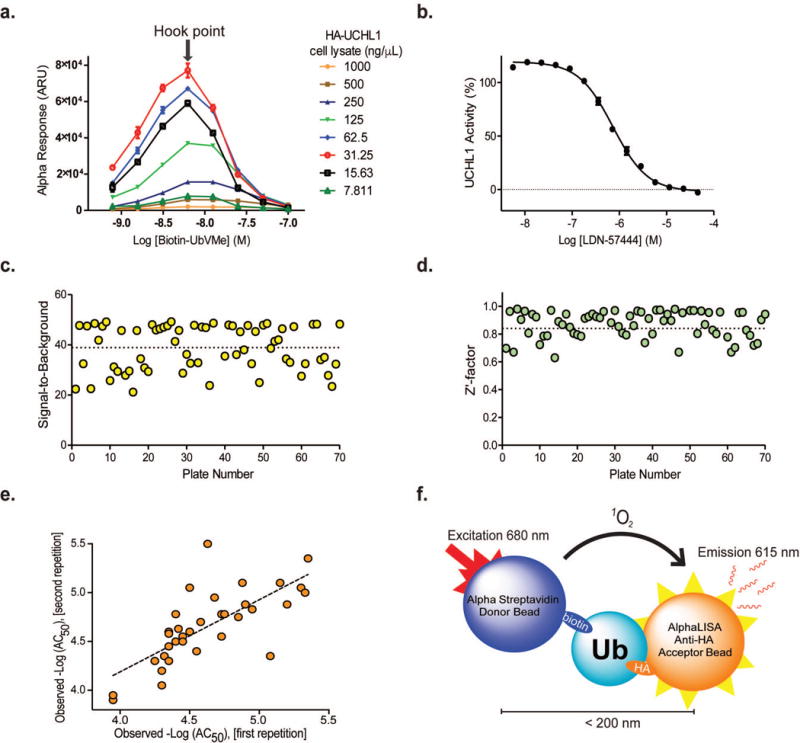
Figure 4.

Miniaturization and adaptation of AlphaLISA DUB Assay for qHTS in 1536-well format. (a) Cross titration to determine optimal conditions for qHTS. (b)Dose–response curve for LDN-57444 inhibition during initial assay optimization. (c, d) Screening statistics of individual plates: signal-to-background ratio (c) and Z′-factor (d). (e) Correlation plot of observed –Log(AC50) values for repeated compounds (R = 0.734, MSR = 3.4 and RMSE = 0.265). (f) Scheme of biotin-Ub-HA counter-screen assay.
