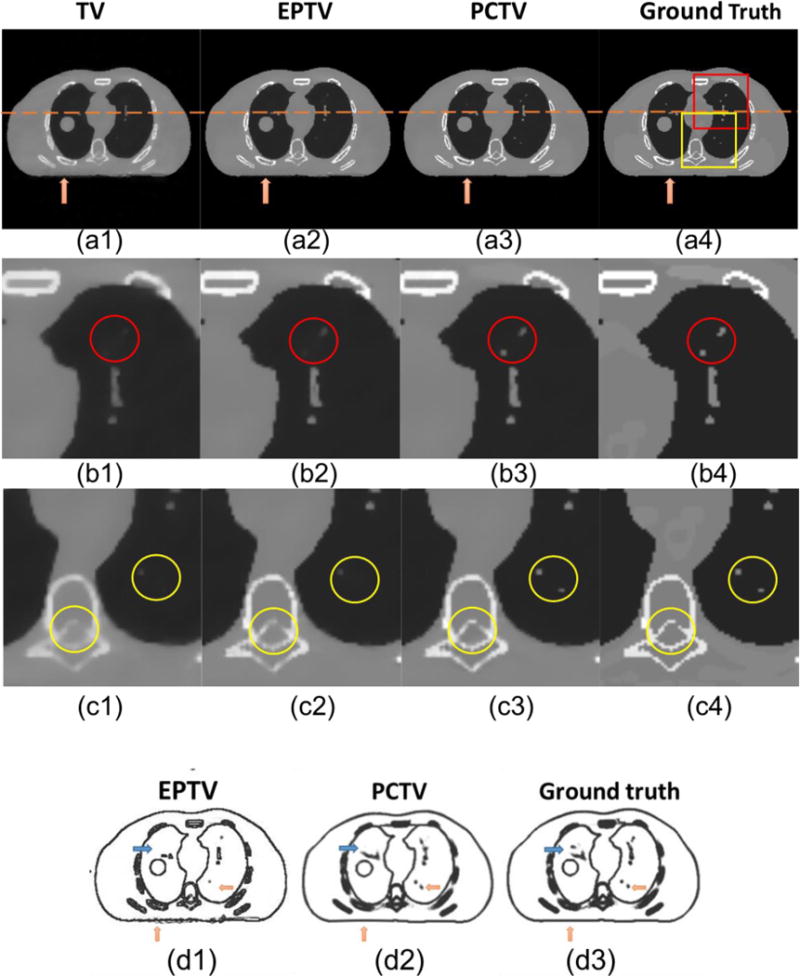
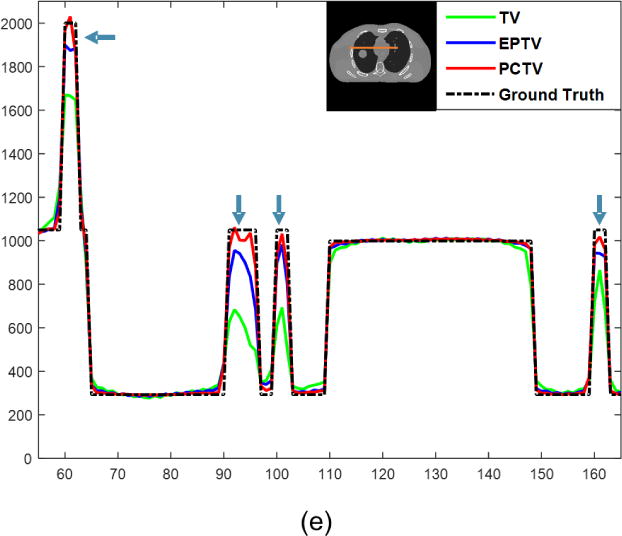
Figure 4.


(a1)–(a4) show reconstructed 45 noise-free projections of XCAT with different breath amplitudes between prior images and on-board CBCT. (b1)–(b4) are the zoomed in images of red square in (a4) and (c1)–(c4) show the zooming in images of yellow square. Both red and yellow circles point that PCTV is superior to other methods in edge enhancement and small structures recovery. From left to right columns: TV, EPTV, PCTV and ground truth. In the fourth row, edge map were compared using 45 half-fan projections as shown in: (d1) weight map of last reconstruction iteration in EPTV, (d2) weight map used in PCTV and (d3) weight map extracted by edge detection on the ground truth images. (e) shows the profiles along the orange line of ground true image shown in (e).
