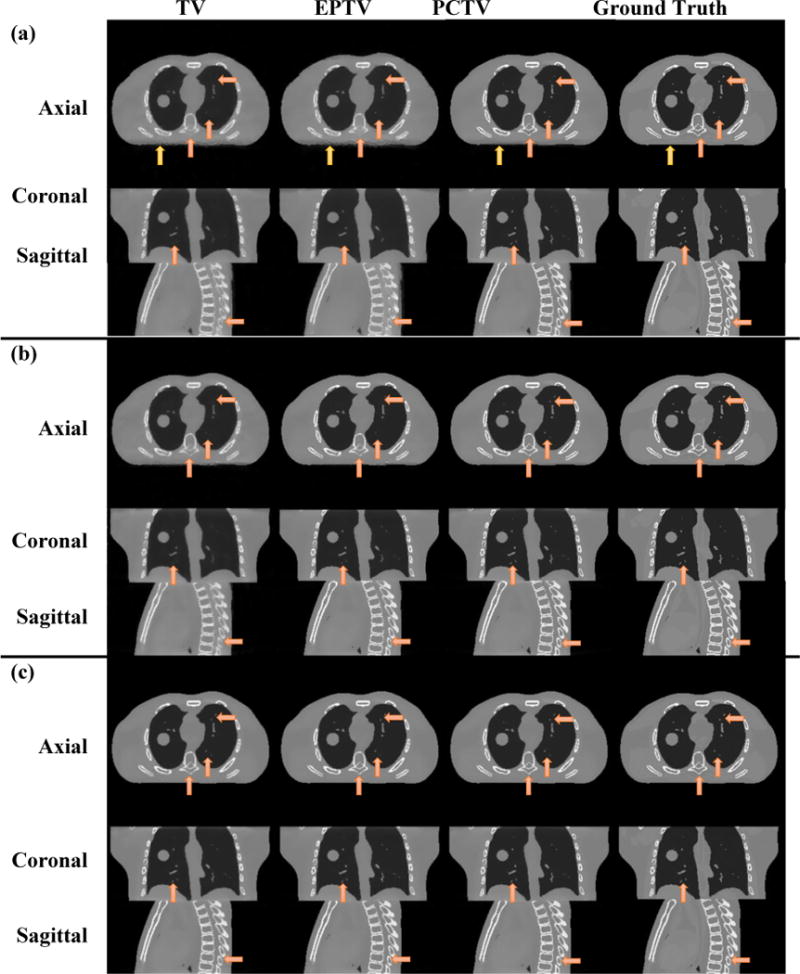
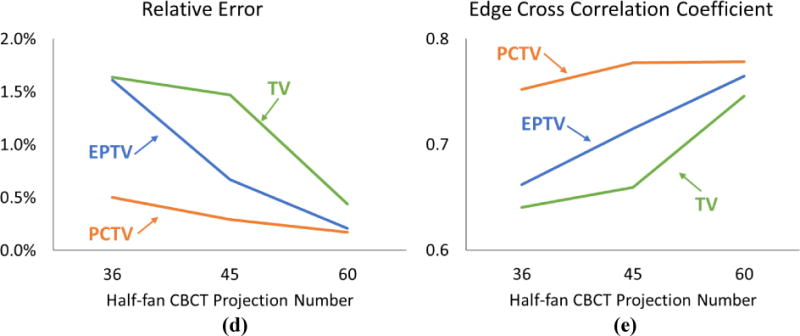
Figure 5.


Comparisons of XCAT CBCT reconstructed via TV, EPTV and PCTV using a) 36projections, b) 45 projections and c) 60 projections. Ground truth are listed at the right column as the reference. In the quantitative evaluation, relative error and edge cross correlation for TV, EPTV and PCTV as functions of the number of CBCT projection number were plotted in (d) and (e), respectively.
