Figure 8.

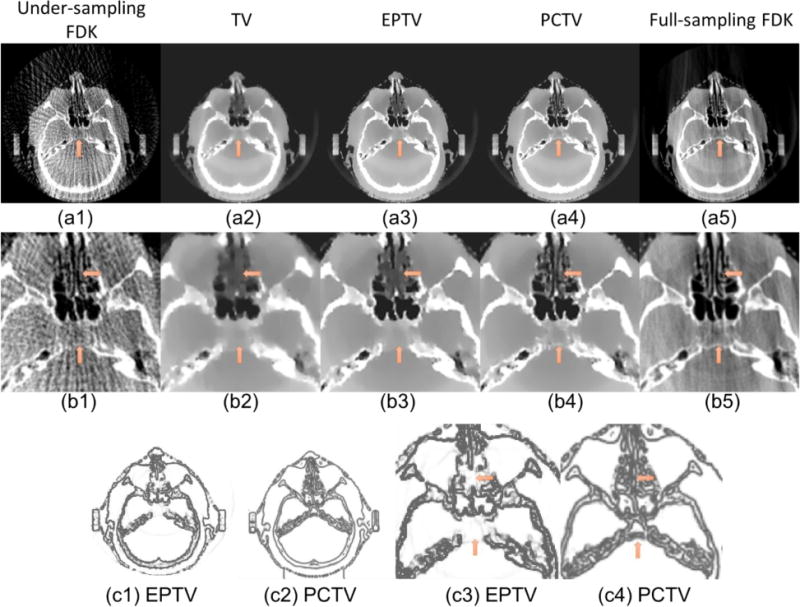
(a1)–(a5) Reconstructed images of patient head. From left to right: FDK (50proj.), TV, EPTV, PCTV and full sampling FDK (500proj.). (b1)–(b5) Zoom in reconstruction images of clinical patient head on the first row. Edge map comparisons: (c1) is the weight map of last reconstruction iteration in EPTV while (c2) is the weight map used in PCTV. (c3) and (c4) are the zooming in of (c1) and (c2) respectively. Arrows point out the differences between weight map in EPTV and PCTV.
