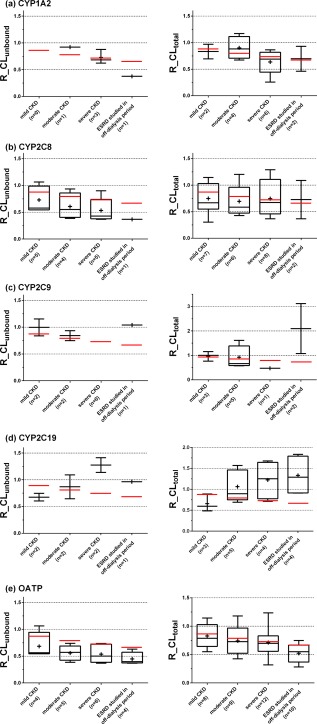
Figure 3.

Effect of chronic kidney disease (CKD) on cytochrome P450 (CYP)1A2 (a), CYP2C8 (b), CYP2C9 (c), CYP2C19 (d) and organic anion transporting polypeptide (OATP) (e) model substrate drugs. The box‐and‐whisker plots represent interquartile range of unbound clearance ratio between CKD patient groups and the healthy control group (R_CLunbound) for drugs with protein binding information, or total clearance ratio between CKD patient groups and the healthy control group (R_CLtotal) for all drugs with CKD studies. The “+” symbols represents the mean value of R_CL, and red lines represent the theoretical lowest ratio assuming no CKD effect on nonrenal clearance (the values are 0.88, 0.79, 0.73, and 0.69 for the mild CKD, moderate CKD, severe CKD, and the endstage renal disease (ESRD) groups, respectively). n, number of CKD studies in each group.
