. 2015 Sep 9;6(12):7049–7058. doi: 10.1039/c5sc01501d

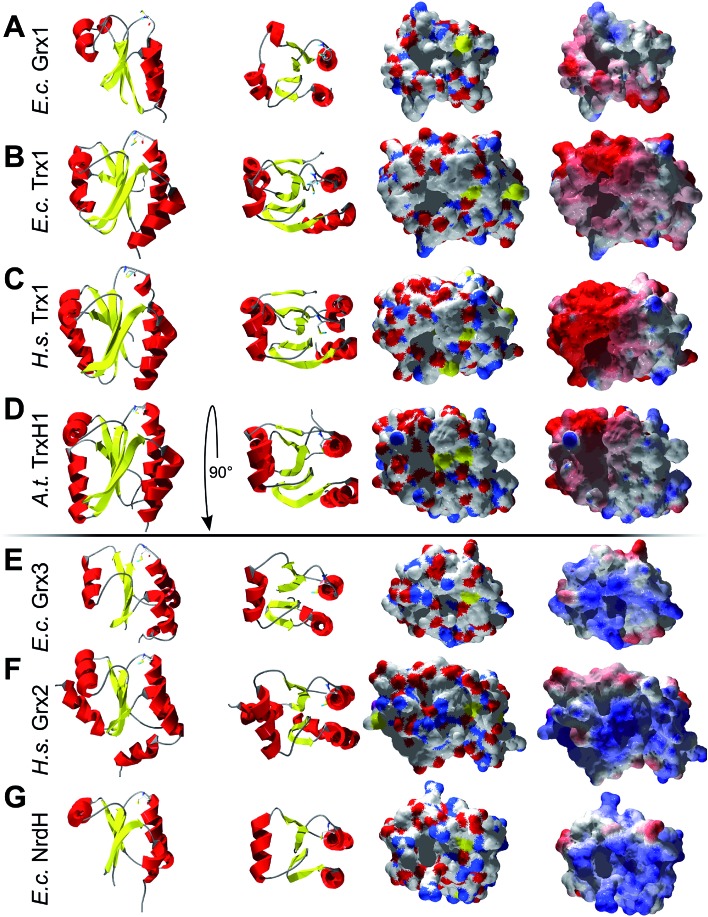
Fig. 5. Structural analysis of some of the Trxs and Grxs tested as electron donor for PAPS reductase. First column: secondary structure representation from the front, second column: secondary structure representation from the top, i.e. rotated by 90° to the front. Third column: surface representation of the active site and potential contact areas in atomic type coloring. Fourth column: electrostatic surface potentials (from red = –4 to blue = +4 kT/e, using atomic partial charges) mapped to the surface. The pictures were computed using the DeepView/Swiss-PDB Viewer 4.1 with PDB accession numbers: (A) E. coli Grx1 (; 1egr),31, (B) E. coli Trx1 (; 1xob),34 (C) human Trx1 (; 1ert),38 (D) A. thaliana TrxH1 (; 1xfl),37 (E) E. coli Grx3 (; 3grx),33 (F) human Grx2 (; 2fls), and (G) E. coli NrdH (; 1h75).35.

Fig. 5