. 2015 Sep 9;6(12):7049–7058. doi: 10.1039/c5sc01501d

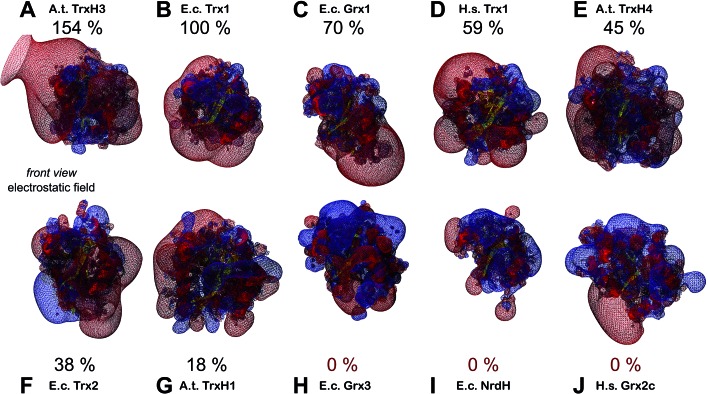
Fig. 6. Electrostatic potential maps of some of the redoxins tested as electron donors for PAPS reductase. The figures show the secondary structure representations (in front view, see Fig. 4, first column) with the computed electric fields protruding into the surrounding solvent. Additionally, the efficiency of PR with the various redoxins as electron donor were included. The electrostatic potential maps (from red = –4 to blue = +4 kT per e, using atomic partial charges) and the pictures were computed using the DeepView/Swiss-PDB Viewer 4.1. The structures marked with an asterisk were not experimentally determined but computed here by molecular modelling using the Swiss-model server. (A) A. thaliana TrxH3* (modelled with template ; 1wmj), (B) E. coli Trx1 (; 1xob), (C) E. coli Grx1 (; 1egr), (D) human Trx1 (; 1ert), (E) A. thaliana TrxH4*(modelled with template ; 1wmj), (F) E. coli Trx2* (modelled with template ; 3p2a), (G) A. thaliana TrxH1 (; 1xfl), (H) human Grx2 (; 2fls), (I) E. coli Grx3 (; 3grx), and E. coli NrdH (; 1h75).

Fig. 6