. 2015 Sep 9;6(12):7049–7058. doi: 10.1039/c5sc01501d

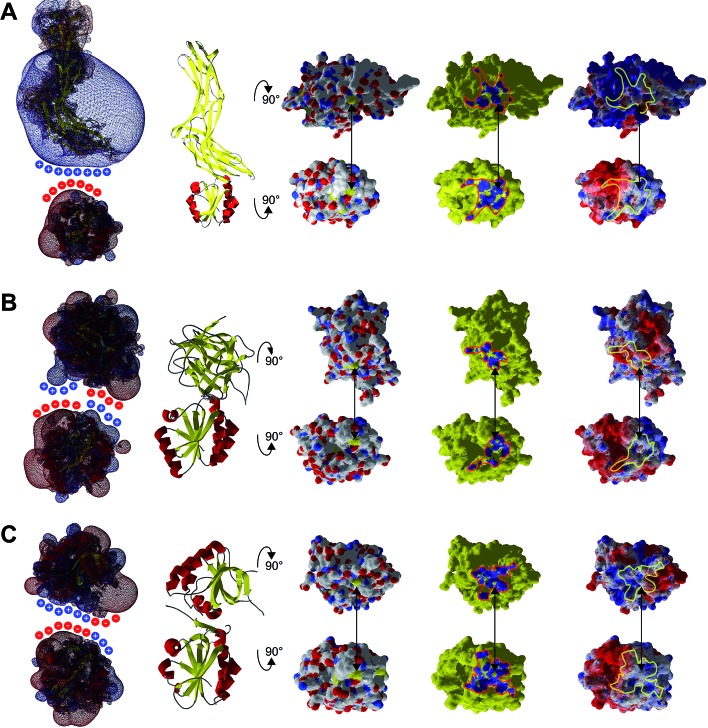
Fig. 7. Interaction analysis of other Trx–target protein complexes from the protein data bank. A ribbon representation of the complexes is shown in the second column. The atomic, interacting and electrostatic surfaces are shown in columns three to five, arranged as in Fig. 2. The first column features the electrostatic maps of the interacting proteins separated from each other. A crude representation of the surface charges was added to highlight the complementarity of the electrostatic fields of the proteins pointing to each other with their interacting surfaces. (A) Complex between human Trx1 and the thioredoxin interacting protein (TXNIP), pdb code ; 4ll4. (B) Complex between Hordeum vulgare (barley) TrxH2 and BASI, pdb code ; 2iwt. (C) Complex between yeast Trx1 and methionine sulfoxide reductase A (MsrA), pdb code ; 3pin.

Fig. 7