. 2015 Sep 17;6(12):7227–7237. doi: 10.1039/c5sc02409a

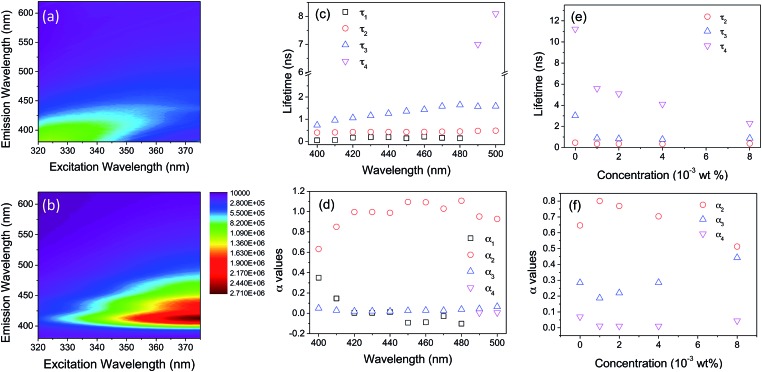
Fig. 6. Excitation-emission data maps for (a) DI-PBS-0.0 and (b) DI-PBS-1.0, where λex = 320–375 nm (1 nm intervals) and λem = 380–650 nm (1 nm intervals). (c) Emission lifetimes and (d) corresponding pre-exponential αi values as determined from the fitting of tri-exponential functions to the fluorescence decays of the sample DI-PBS-1.0 as a function of emission wavelength (λem = 400, 410, 420, 430, 440, 450, 460, 470, 480, 490 and 500 nm) (λex = 365 nm). (e) Emission lifetimes and (f) corresponding pre-exponential αi values as determined from the fitting of tri-exponential functions to the fluorescence decays for the DI-PBS-x series at the di-ureasil emission wavelength (λex = 365 nm, λem = 500 nm).

Fig. 6