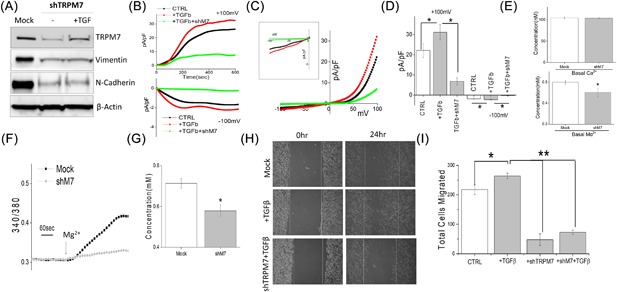
Figure 3.

(A) Western blot showing the expression of TRPM7, Vimentin, N‐cadherin, and β‐actin as loading control in DU145 cells under various conditions. Mock indicates cells treated with control shRNA, whereas the other set of cells were treated with shTRPM7 with and without TGFβ. Whole cell recordings showing outward/inward currents at +100 mV/‐100 mV under various conditions in DU145 cells are shown in (B). Respectively IV curves are shown in (C) (insert indicate the magnification of inward IV curves) and quantitation (5‐8 recordings) of current intensity at ±100 mV is shown in (D). * indicate significance (P < 0.05). (E) Quantification of basal intracellular calcium or magnesium concentration under normal SES solution in mock and TRPM7 knockdown DU145 cells. (F) Mg2+ imaging was performed using mag‐fura in mock and TRPM7 knockdown DU145 cells. Bath application of Mg2+ induces Mg2+ influx and analog plots of the fluorescence ratio (340/380) from an average of 30‐50 cells are shown. (G) Quantification (mean ± SD) of Mg2+ concentration. * indicate significance (P < 0.05). (H) Respective images showing the wound‐healing assay for cellular migration in DU145 pretreated for 24 h with 5 ng/mL TGFβ in mock (control shRNA) and TRPM7 knockdown DU145 cells (shTRPM7) pretreated with 24 h with TGFβ. Images were taken after the wound scratch (0 h) and after 24 h, respectively. The pictures are representative of four separate experiments. (I) Transwell migration of mock or shTRPM7 treated cells after TGFβ stimulation with and migrated for 6 h. Four random fields at 10× were counted from four experiments indicating total cells migrated ± SEM. *** indicates significance (P < 0.001)
