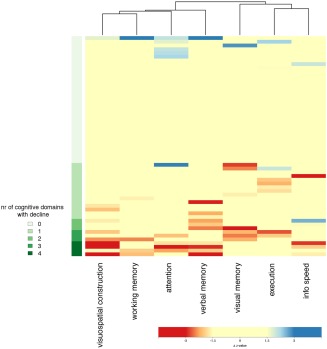
Figure 2.

Heat map of cognitive alteration in 59 patients in rows by cognitive domain in columns. Patients are ordered by number of cognitive domains with decline (green color coding on left). Domains are ordered by unsupervised clustering. No clustering profiles are identified. Cognitive decline is shown in shades of red; cognitive improvement in shades of blue; and unchanged cognitive performance in yellow (see bottom color legend) [Color figure can be viewed at http://www.wileyonlinelibrary.com]
