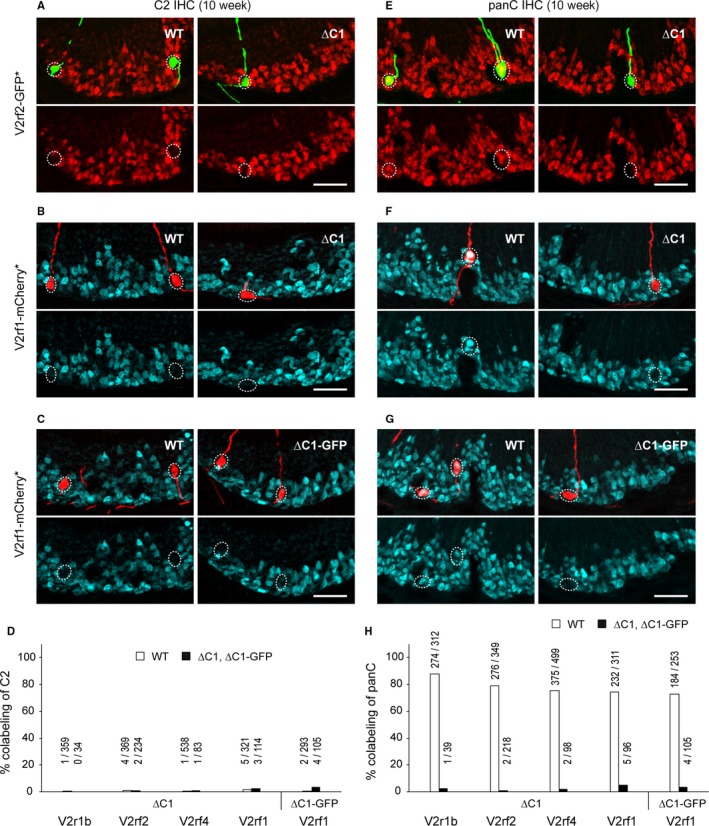
Figure 4.

No compensatory expression of Vmn2r2 through Vmn2r7 in the absence of Vmn2r1. (A,B) IHC with anti‐C2 antibody on coronal VNO sections of WT and ∆C1 mice from the crosses ∆C1 × V2rf2‐GFP (A) and ∆C1 × V2rf1‐mCherry (B). In (A) intrinsic GFP fluorescence (indicated with an asterisk) is shown in green, and C2 immunoreactivity in red. In (B) intrinsic mCherry fluorescence is shown in red, and C2 immunoreactivity in blue. Mice were male and 10 weeks old. Scale bar, 50 μm. (C) IHC with anti‐C2 antibody (blue) on coronal VNO sections of WT and ∆C1‐GFP mice from the cross ∆C1‐GFP × V2rf1‐mCherry at 10 weeks. Intrinsic mCherry fluorescence is shown in red. Scale bar, 50 μm. (D) Summary of the percentage of colabeling with anti‐C2 antibody in VSNs that express a fluorescence marker from a gene‐targeted locus. Four mice per genotype were analyzed for each cross. Samples were from the 10‐week‐old male mice that were used for VSN counting in Figs 2 and 3. Above each bar, the number of double‐labeled VSNs/number of fluorescence marker‐positive VSNs is given. (E,F) IHC with anti‐panC antibody on coronal VNO sections of WT and ∆C1 mice from the crosses ∆C1 × V2rf2‐GFP (E) and ∆C1 × V2rf1‐mCherry (F) at 10 weeks. In (E) intrinsic GFP fluorescence is shown in green, and panC immunoreactivity in red. In (F) intrinsic mCherry fluorescence is shown in red, and panC immunoreactivity in blue. Scale bar, 50 μm. (G) IHC with anti‐panC antibody (blue) on coronal VNO sections of WT and ∆C1‐GFP mice from the cross ∆C1‐GFP × V2rf1‐mCherry at 10 weeks. Intrinsic mCherry fluorescence is shown in red. Scale bar, 50 μm. (H) Summary of the percentage of colabeling with panC antibody in fluorescence marker‐expressing VSNs. Four 10‐week‐old male mice per genotype were analyzed for each cross.
