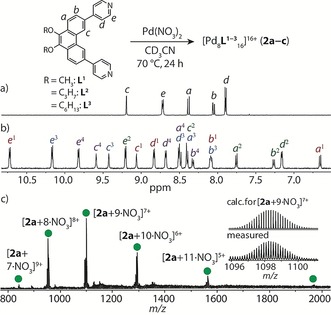
Figure 2.

Top: Reaction equation representing the formation of Pd8L16 (2 a–2 c). Bottom: 1H NMR spectra (500 MHz, CD3CN, 25 °C) of a) ligand L1 and b) 2 a. c) ESI‐MS spectrum of 2 a with the measured and calculated isotope patterns of [2 a+9 NO3]7+ shown in the inset.
