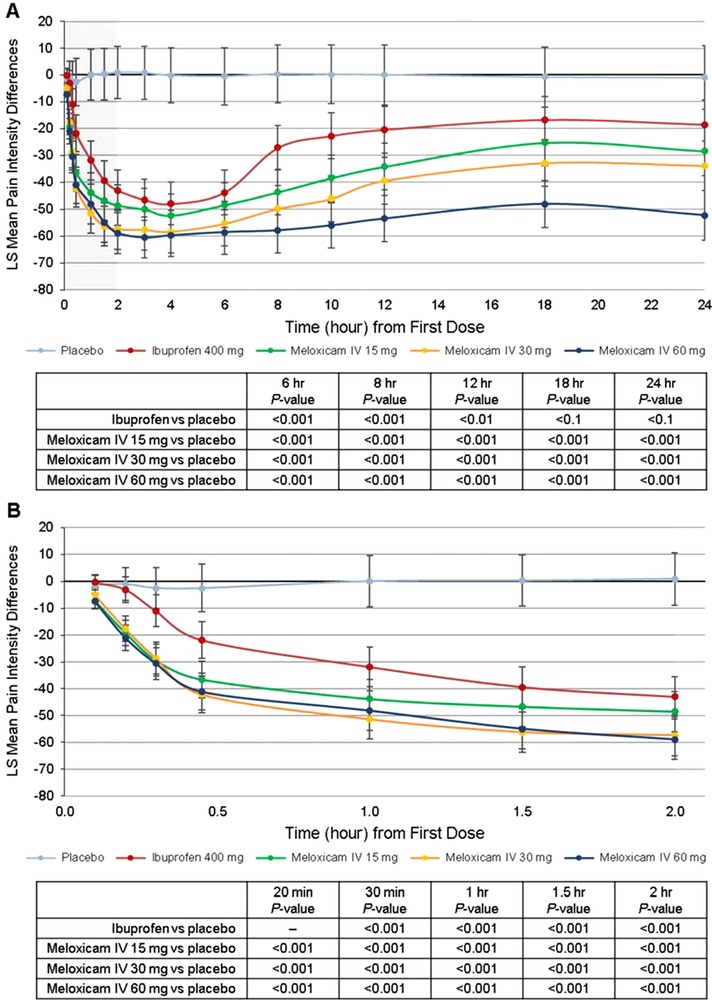
Figure 4.

Summary of least squares (LS) mean pain intensity differences over (A) the first 24 hours and (B) the first 2 hours. Error bars represent the range of the 95%CIs. IV indicates intravenous dosing.

Summary of least squares (LS) mean pain intensity differences over (A) the first 24 hours and (B) the first 2 hours. Error bars represent the range of the 95%CIs. IV indicates intravenous dosing.