
Figure 4.
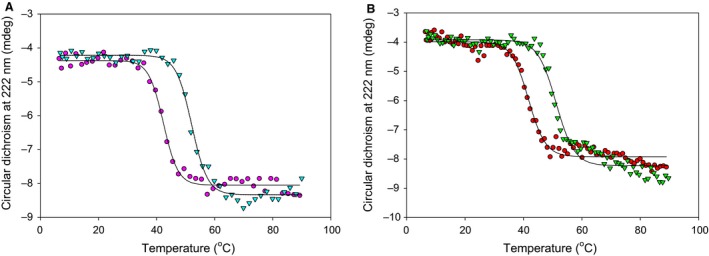
Thermostability of the two human ZnT8 CTD variants. (A) Representative (n ≥ 3) melting curves for apo‐ZnT8cR (magenta circles, T m = 42.8 ± 0.5 °C) and ZnT8cR with two molar equivalents of Zn2+ (teal triangles, T m = 54.5 ± 2.1 °C) measuring the change in CD at 222 nm from 6 to 92 °C with a heating rate of 1 °C·min−1. (B) Representative (n = 3) CD melting curves of apo‐ZnT8cW (red circles, T m = 41.4 ± 0.4 °C) and ZnT8cW in the presence of two molar equivalents of Zn2+ (green triangles, T m = 51.0 ± 1.8 °C). There are significant differences between thermal stability of apo‐ZnT8cR and apo‐ZnT8cW (n = 3, P = 0.013) and between both apo‐variants and the variant in the presence of Zn2+ (for each comparison n = 3, P < 0.001). The difference in stability between the two variants in the presence of Zn2+ is not statistically significant (P = 0.093).