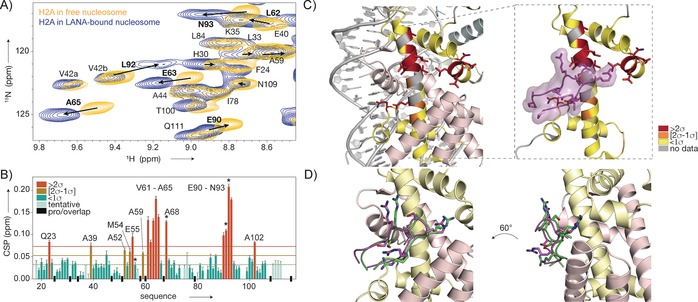
Figure 3.

Mapping of the LANA binding site on the nucleosome surface by ssNMR spectroscopy. A) Overlay of the 2D NH spectra of H2A in sedimented nucleosomes (yellow) and nucleosome–LANA complexes (blue). Residues with significant chemical shift changes labeled in bold, peak displacement indicated with arrows. B) Weighted chemical shift perturbations (CSPs) per residue. The 10 % trimmed mean values (dashed line) plus one (orange line) or two (red line) standard deviations (σ) are indicated. Residues with significant peak broadening in the bound state are labeled with asterisks. C) CSPs color‐coded on the structure of H2A. Residues with high CSPs co‐localize with the binding site of LANA (PDB ID 1ZLA). D) NMR data driven model of the LANA–nucleosome complex, showing the best‐scoring water‐refined solution (green). This model corresponds to the crystal structure (magenta) within 1.5 Å backbone RMSD.
