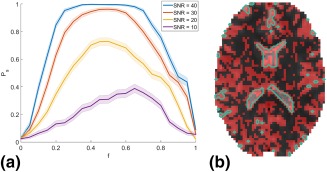
Figure 2.

a: The maximum likelihood estimate of the probability of success Ps where the DKI‐FWE model is significantly better at describing the data compared to the standard DKI model for simulated data in function of the true free water signal fraction f. Colored bands indicate the 95% confidence interval (b) B 0 image overlayed with the voxels where the DKI‐FWE model describes the data significantly better compared to the standard DKI model (red). Cerebrospinal fluid (CSF) regions are indicated with a green contour plot.
