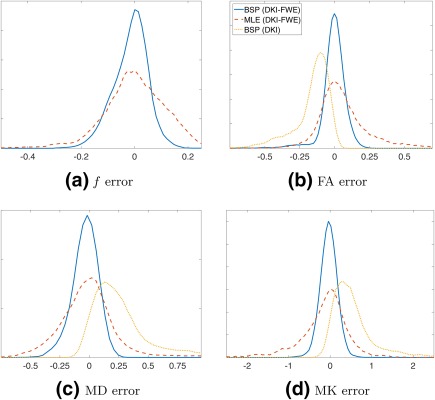
Figure 3.

Error distributions of f (a), fractional anisotropy (FA) (b), mean diffusivity (MD) (c), and mean kurtosis (MK) (d), for 3 different diffusion model and estimation technique combinations: BSP with the DKI‐FWE model (solid blue), ML with the DKI‐FWE model (dashed red) and BSP with the standard DKI model (dotted yellow).
