Figure 6.

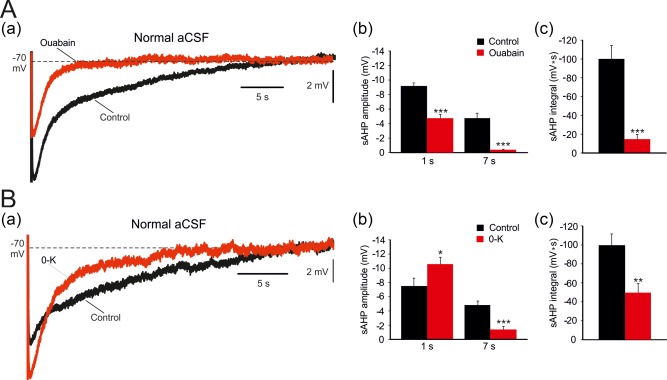
Effects of NKA inhibition on the entire sAHP. (A. a) In a representative neuron, sAHPs were evoked by 50 Hz spike trains of 150 spikes in a normal aCSF. Application of 10 μM ouabain reduced the sAHPs, particularly the late phase (the traces depict the sAHPs before and 20 min after ouabain application, respectively). (b and c) Bar diagrams depicting the pooled results (mean ± SEM; n = 6) for sAHP amplitudes (measured at 1 and at 7 s post‐stimulus) and integrals, respectively. (B. a) Same as in Aa, but NKA inhibition was attained by exchanging the normal aCSF with 0‐K‐aCSF. Note that the early phase of the sAHP increases in 0‐K‐aCSF whereas the late phase is reduced. (b and c), Bar diagrams depicting the pooled results (mean ± SEM; n = 8) for sAHP amplitudes (measured at 1 and at 7 s post‐stimulus) and integrals, respectively [Color figure can be viewed at http://wileyonlinelibrary.com]
