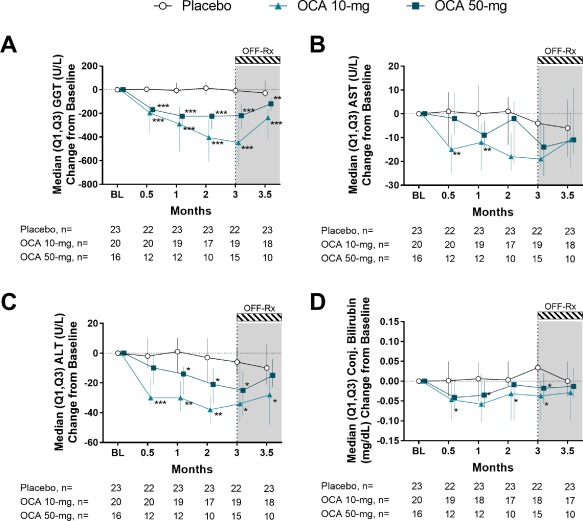
Figure 2.

Effect of OCA on liver biochemistries. (A) GGT change from baseline. (B) AST change from baseline. (C) ALT change from baseline. (D) Conjugated bilirubin change from baseline. Data are median (Q1, Q3). Change from baseline values at month 3 include the ET visit data for patients who discontinued. * P < 0.05, ** P < 0.01, *** P < 0.0001; P values determined by pairwise comparisons using a two‐sided Wilcoxon‐Mann‐Whitney test comparing changes in each OCA group with the placebo group. Abbreviation: BL, baseline.
