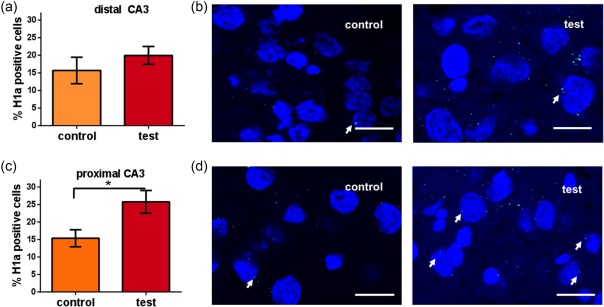
Figure 6.

Homer1a mRNA expression is increased in the proximal CA3 region after landmark cue exploration. Bar charts show Homer1a mRNA expression in the CA3 subregions after landmark cues exploration. Interestingly, the proximal CA3 region (c) but not the distal CA3 (a) region responded to the novel landmark exploration. One way ANOVA: *p < .05. Images show Homer1a expression (green points, indicated by white arrows) in the distal (b) and proximal CA3 (d) of a control animal (control) and an animal that was exposed to landmark cues (test). Blue: nuclear staining with DAPI. Images were taken using a 63× objective. Scale bar: 10 μm [Color figure can be viewed at http://wileyonlinelibrary.com]
