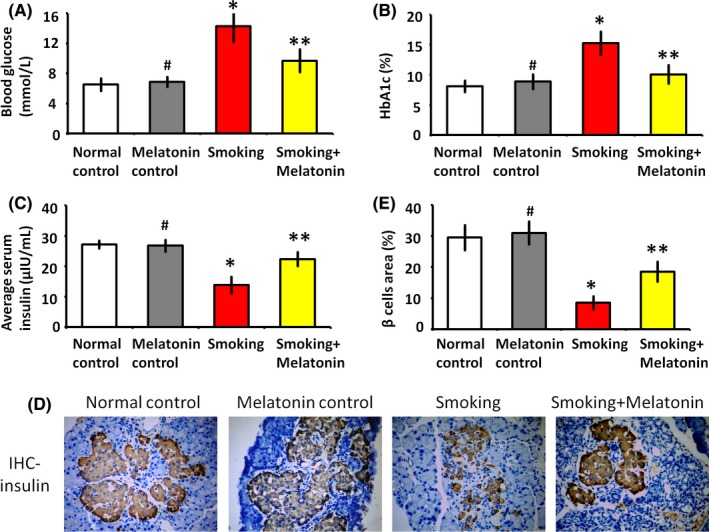
Figure 1.

The levels of blood glucose and insulin secretion. (A and B) The level of blood glucose and hemoglobin A1c (HbA1c) in the different groups. (C) Serum insulin levels of the different groups. (D) The brownfield area in the immunohistochemistry (IHC) images shows the area of β cells in the islets. (E) The histogram shows quantification of β cells area in IHC images. #P > .05 melatonin control vs normal control, *P < .05 smoking vs normal control, **P < .05 smoking+melatonin vs smoking
