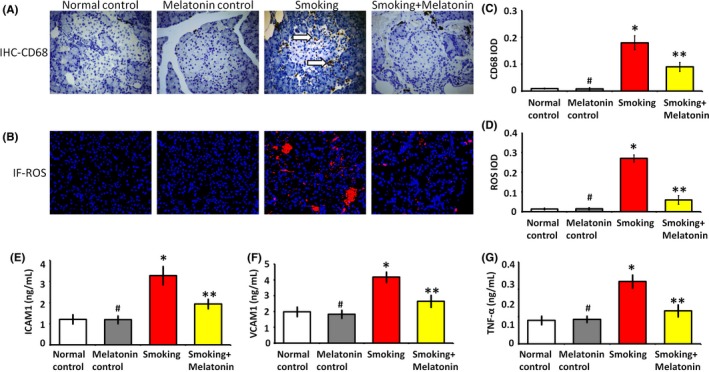
Figure 3.

Inflammation and ROS production in islets. (A) In immunohistochemistry (IHC) images, the white arrow shows the infiltration of CD68 inflammatory cells into islet. (B) In immunofluorescence (IF) images, the red fluorescence shows ROS production in islets. (C and D) These histograms show the quantification of integrated optical density (IOD) from CD68 and ROS images, respectively. (E, F and G) The levels of inflammatory factors, intercellular adhesion molecule‐1 (ICAM1), vascular cell adhesion molecule‐1 (VCAM1), and tumor necrosis factor‐α (TNF‐α) in islets suspension, respectively. #P > .05 melatonin control vs normal control, *P < .05 smoking vs normal control, **P < .05 smoking + melatonin vs smoking
