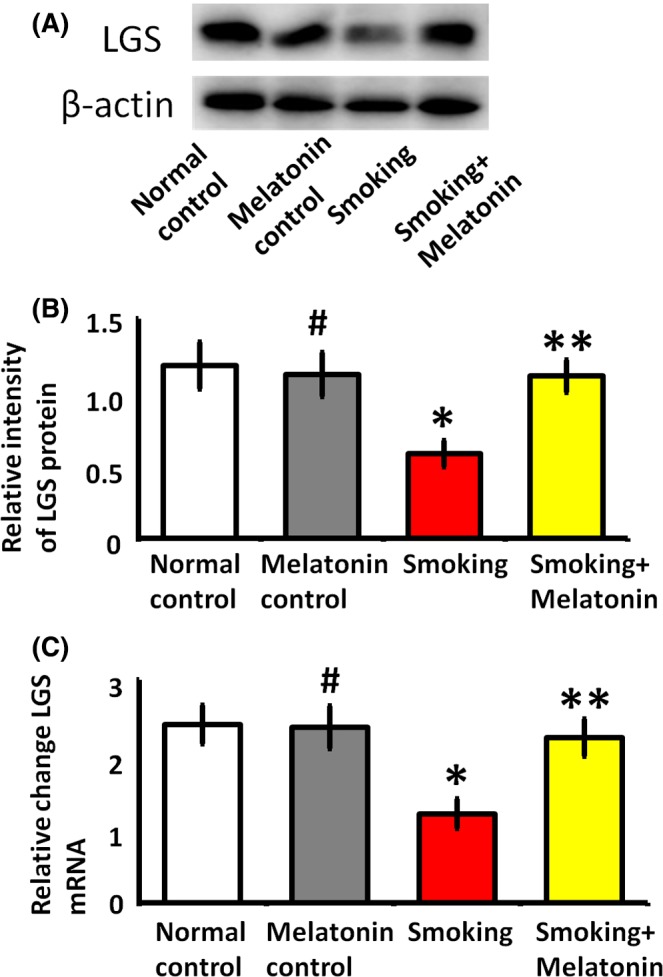
Figure 6.

The expression of glycogen synthase (LGS) in hepatocytes. The hepatocytes were cultured in the medium with 5% rats serum of different groups for 24 h. (A) Western blot analysis of LGS expression. (B) Quantitative analysis of LGS expression. (C) Quantitative real‐time PCR analysis of LGS gene transcription. #P > .05 melatonin control vs normal control, *P < .05 smoking vs normal control, **P < .05 smoking + melatonin vs smoking
