Figure 7.

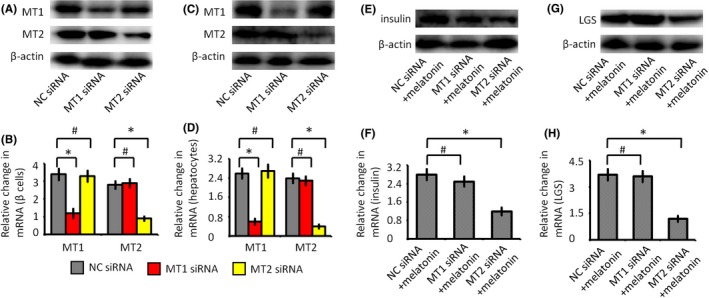
The effects of melatonin receptors on glucose metabolism. (A) Western blot analysis of melatonin receptors (MT1 and MT2) expressions in β cells. (B) Quantitative real‐time PCR analysis of MT1 and MT2 gene transcription in β cells. (C) Western blot analysis of MT1 and MT2 expressions in hepatocytes. (D) Quantitative real‐time PCR analysis of MT1 and MT2 gene transcription in hepatocytes. (E) Western blot analysis of insulin expressions in β cells. (F) Quantitative real‐time PCR analysis of insulin in β cells. (G) Western blot analysis of liver glycogen synthase (LGS) expressions in hepatocytes. (H) Quantitative real‐time PCR analysis of LGS gene transcription in hepatocytes. NC siRNA group, cells were transfected with negative control siRNA; MT1 siRNA group, cells were transfected with MT1 siRNA; MT2 siRNA group, cells were transfected with MT2 siRNA; NC siRNA + melatonin group, cells were transfected with negative control siRNA, and then cultured with melatonin for 24 h; MT1 siRNA + melatonin group, cells were transfected with MT1 siRNA and then cultured with melatonin for 24 h; MT2 siRNA+melatonin group, cells were transfected with MT2 siRNA and then cultured with melatonin for 24 h. #P > .05, *P < .05
