Figure 8.

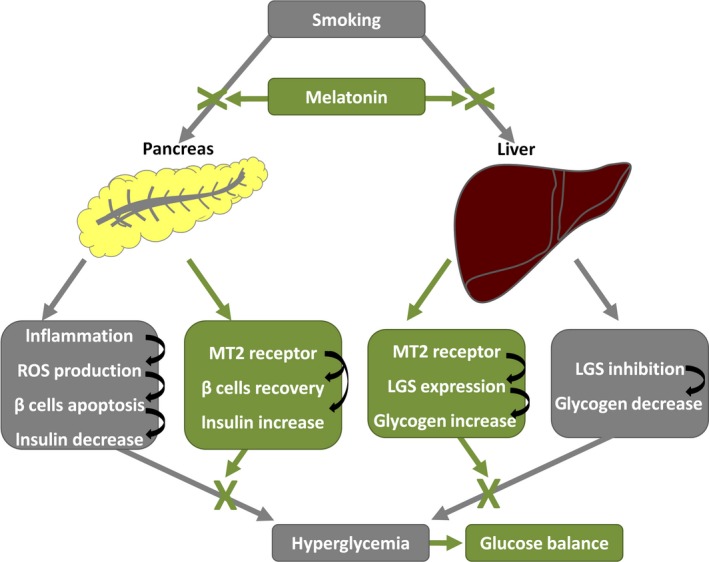
Diagram represents the protective function of melatonin against smoking‐induced hyperglycemia. The gray blocks and lines represent the effects of smoking. The green blocks and lines represent the effects of melatonin

Diagram represents the protective function of melatonin against smoking‐induced hyperglycemia. The gray blocks and lines represent the effects of smoking. The green blocks and lines represent the effects of melatonin