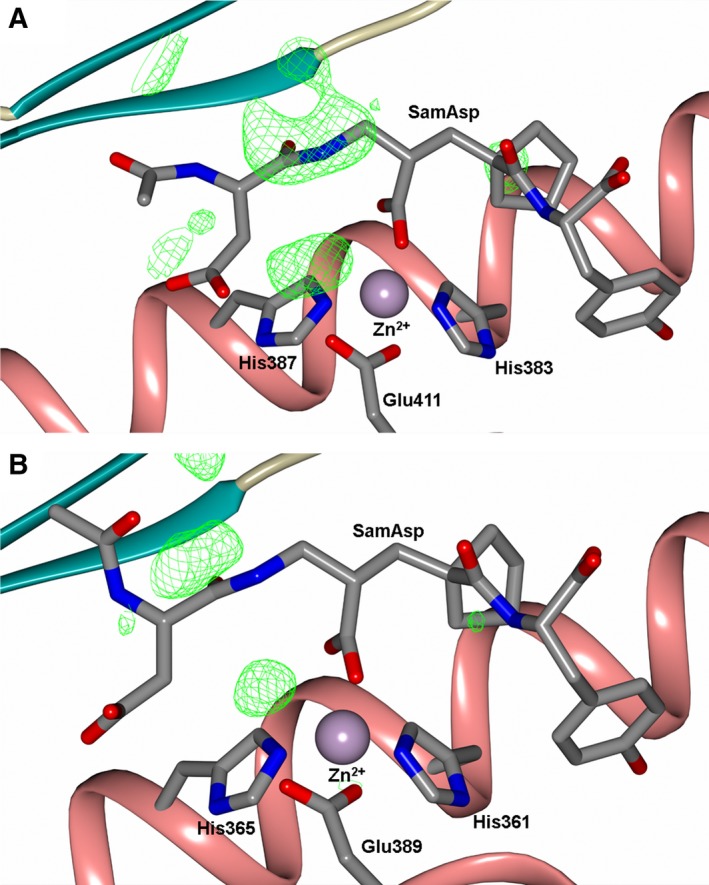
Figure 2.

Schematic representation of (A) SamAsp‐cACE‐ and (B) SamAsp‐nACE‐binding sites overlayed with the final mFo‐DFc (green, contoured at 3σ level) electron density difference map highlighting the electron density that is maybe from an alternate conformation of the samAsp P1/P2 groups. The zinc ion is shown as a lilac sphere with the coordinating side chains shown as sticks. Alpha‐helices and β‐strands are shown in rose and dark cyan respectively.
