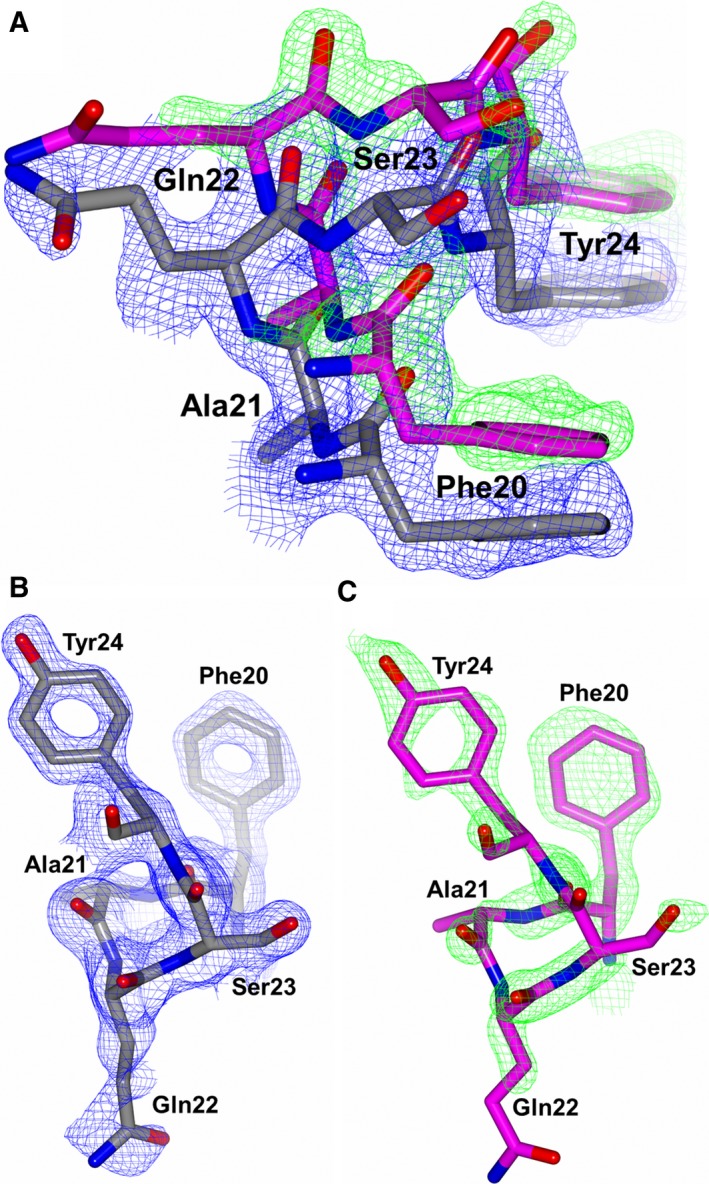
Figure 3.

Residues 20–24 of nACE from the sampatrilat complex structure to highlight the second conformation of part of the nACE hinge region observed. (A) Both conformations, (B) Predominant conformation and (C) Alternate conformation overlayed with the 2mFo‐DFc (blue, contoured at 1σ level) and mFo‐DFc (green, contoured at 3σ level) electron density omit maps.
