Figure 8.

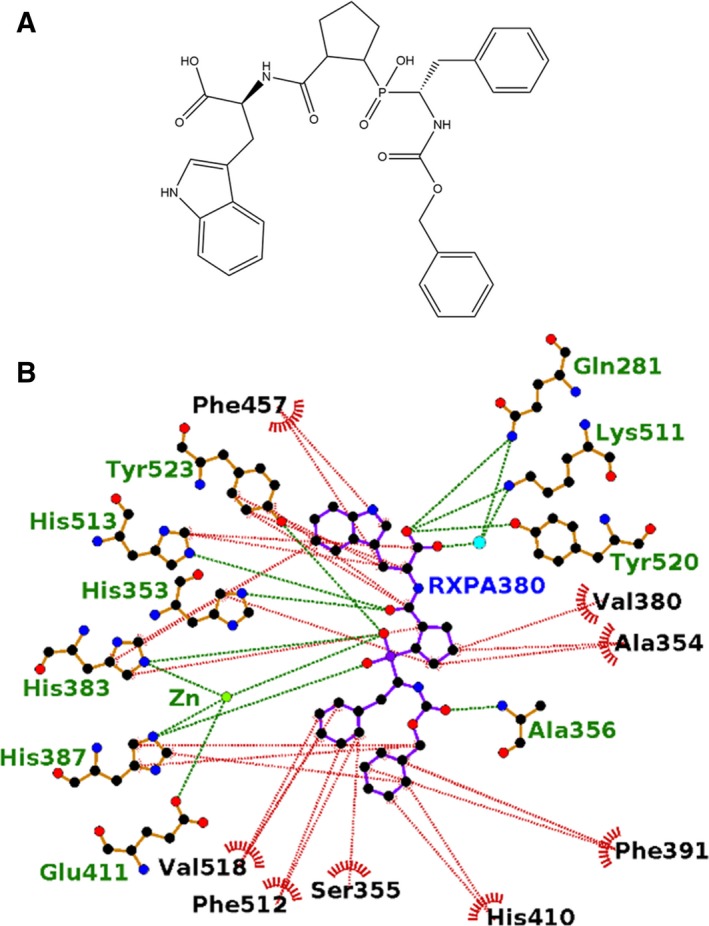
(A) Structure of RXPA380. (B) Ligplot representation of the binding site interactions of RXPA380 in cACE. H‐bond/electrostatic interactions are shown in green, hydrophobic interactions in red and water molecules as cyan spheres.

(A) Structure of RXPA380. (B) Ligplot representation of the binding site interactions of RXPA380 in cACE. H‐bond/electrostatic interactions are shown in green, hydrophobic interactions in red and water molecules as cyan spheres.