
Figure 5.
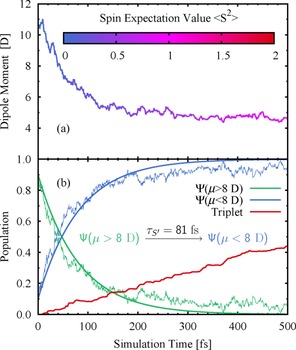
a) Mean value of the dipole moment ⟨μ(t)⟩ of all trajectories. Color of the line corresponds to the spin expectation value ⟨S2⟩=S(S+1). b) Time evolution of the quantum populations of all states with a dipole moment smaller/larger than 8 D and of all triplet states.