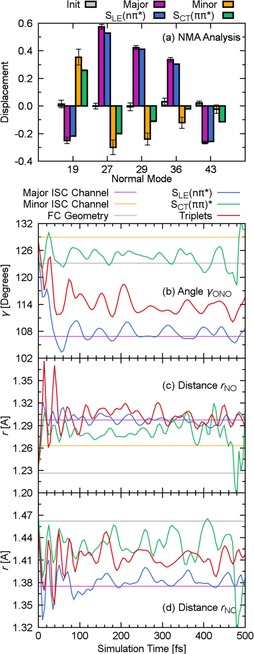
Figure 6.

a) Normal mode analysis (NMA) of the geometries in the initial conditions, all hopping geometries in the major and minor pathway, and all geometries in the SLE(nπ*) and SCT(ππ*) states. b–d) In dashed lines, the averaged internal coordinate at the hopping geometries of the major (violet) and minor (orange) ISC pathways, and at the FC geometry (gray). In solid lines, the time evolution of the internal coordinate for the corresponding trajectories in the SLE(nπ*) (blue), SCT(ππ*) (green) or any triplet state (red).
