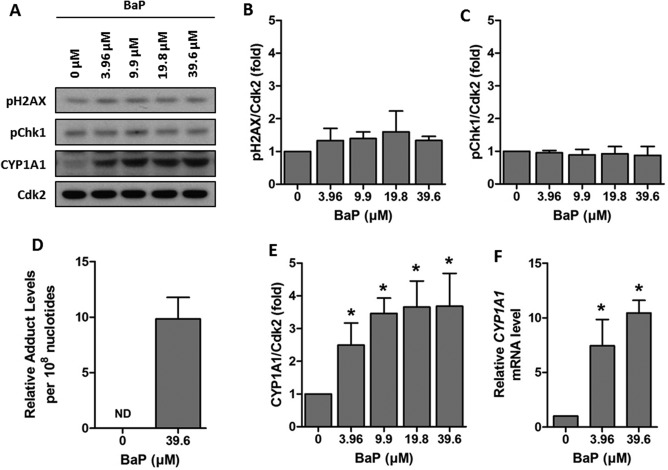
Figure 3.

Genotoxic response of TT1 cells exposed to BaP. Cells were exposed to 0 – 39.6 µM of BaP for 24 hr. A: Representative Western blots of pH2AX, pChk1 and CYP1A1. B and C: Densitometric analysis of levels of pH2AX and pChk1 assessed by Western blotting. D: 32P‐postlabelling analysis of BaP‐DNA adducts in cells exposed to 39.6 µM BaP (ND indicates no detected levels in control cells). E: Densitometric analysis of levels of CYP1A1 assessed by Western blotting. F: Real‐time RT‐PCR analysis of CYP1A1 mRNA. Data are normalised against control levels and hence no error bars are presented in the control samples. Experiments were performed at least in triplicate and data points represent the mean values ± SD. * P < 0.05 as determined by one‐way repeated measures ANOVA with Tukey's post hoc test.
