Figure 5.

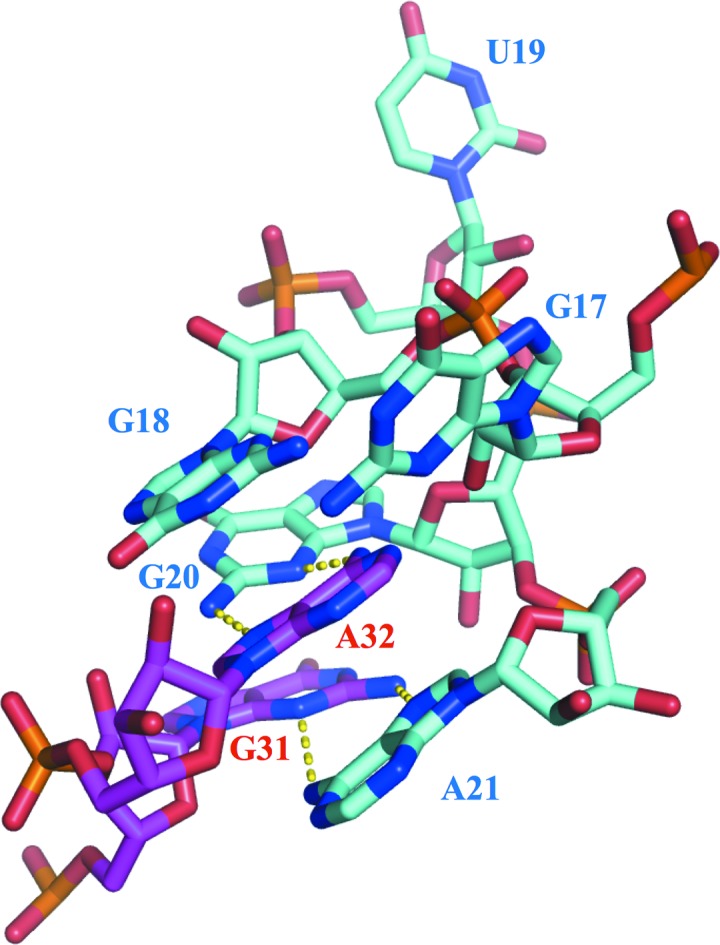
Structure of the K-turn. Nucleobases composing the K-turn in P12.2M are shown in stick representation. Hydrogen bonds between G20 and A32 and between A21 and G31 are shown by dashed lines.

Structure of the K-turn. Nucleobases composing the K-turn in P12.2M are shown in stick representation. Hydrogen bonds between G20 and A32 and between A21 and G31 are shown by dashed lines.