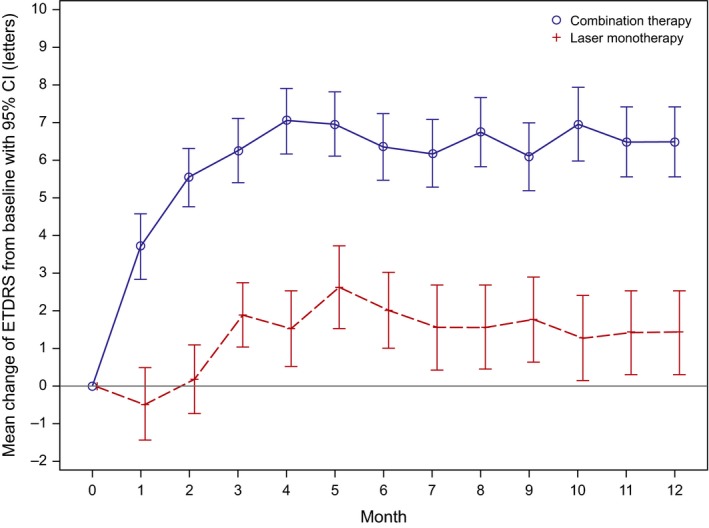
Figure 3.

Mean change in BCVA values over time from baseline (LOCF, FAS). Note: error bars indicate 95% confidence intervals; CI = confidence interval; ETDRS = Early treatment diabetic retinopathy study, FAS = full analysis set, LOCF = last observation carried forward. Follow‐up per patient was up to only 11 months as a maximum, but the number of patients decreased as a consequence of premature termination.
