
Figure 4.
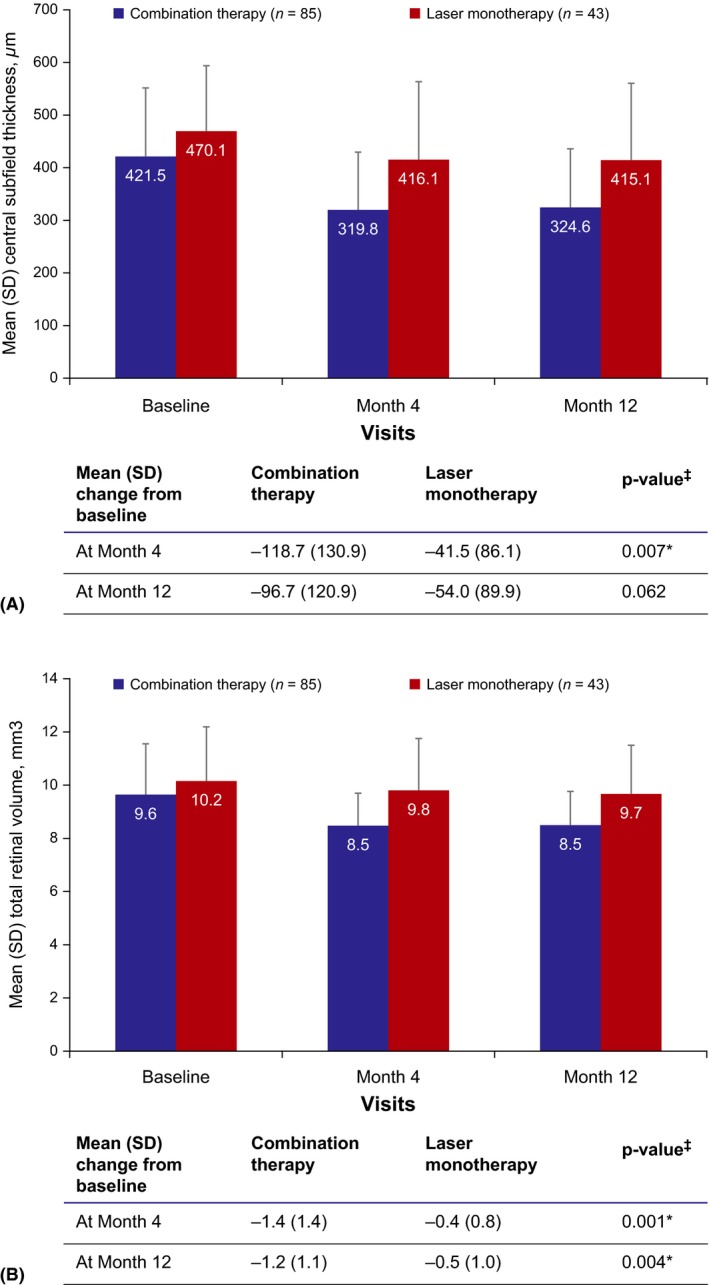
(A) Mean central subfield thickness (μm) and (B) mean total retinal volumea over time (FAS). ‡Paired t‐test p‐value, significance level *p < 0.05. aTotal volume within 6‐mm ETDRS grid. FAS = Full analysis set, SD = standard deviation. Follow‐up per patient was up to only 11 months as a maximum, but the number of patients decreased as a consequence of premature termination.