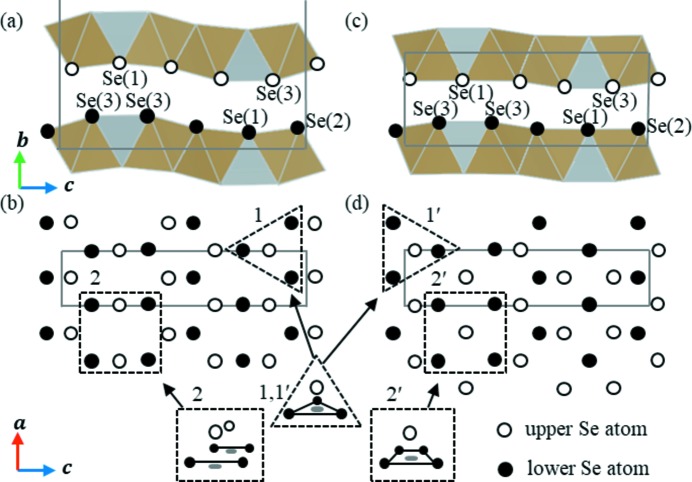
Figure 4.
(a) and (b) Schematic representations of the arrangement of interlayer selenium atoms <3 GPa, viewed from the a and b axes, respectively. (c) and (d) As for panels (a) and (b) but at pressures >3 GPa. In panels (a) and (c) Se(1)–Se(3) represent three different crystallographic sites. Empty and filled circles indicate the upper- and lower-layer Se ions, respectively. Solid lines represent the size and shape of the unit cell. Sites 1 and 2 represent stable and unstable phase II sites, respectively, while sites 1′ and 2′ represent stable phase III sites under high pressure following phase transition.

