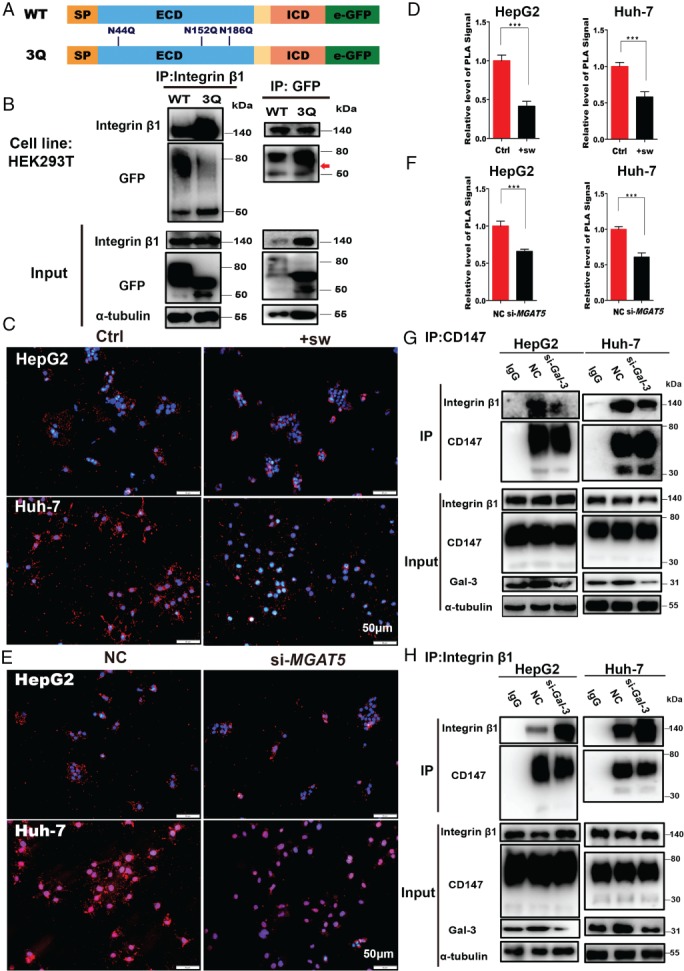
Figure 4.

CD147/basigin‐β1,6‐GlcNAc branching is required for the interaction with integrin β1. (A) Schematic diagram of the CD147/basigin protein. Full‐length protein was separated into the extracellular domain (ECD) and the intracellular domain (ICD). SP = signal peptide; TM = transmembrane domain. Three N‐glycosylation sites in the ECD domain are labeled in blue (numbers indicate amino acid position). (B) Co‐IP of HEK293T cells transfected with WT‐CD147‐GFP or 3Q‐CD147‐GFP plasmid. Left: CD147‐GFP was immunoprecipitated with anti‐integrin β1 and detected using anti‐GFP (upper panel); 1/10th of the total cell lysate was analyzed as input protein (lower panel). Right: integrin β1 was immunoprecipitated with GFP and CD147‐GFP was detected using anti‐GFP antibodies (upper panel; red arrow indicates a higher level of heavily glycosylated 3Q‐CD147 than WT‐CD147); 1/10th of the total cell lysate was analyzed as input protein (lower panel). (C, D) Fluorescence signal and in situ PLA analysis of the interaction between CD147 and integrin β1 under the indicated conditions (sw, 1 μg/ml). Scale bar = 50 μm. (E, F) Fluorescence signal and in situ PLA analysis of the interaction between CD147 and integrin β1 after silencing MGAT5. Scale bar = 50 μm. (G, H) Co‐IP of CD147 and integrin β1 in HepG2 and Huh‐7 cells transfected with either siRNAs targeting LGALS3 (Gal‐3) or nonspecific control (NC) siRNA. (G) Immunoprecipitation with HAb18G/CD147 antibodies (upper panel); input proteins were detected (lower panel). (H) Immunoprecipitation with integrin β1 antibodies (upper panel); input proteins were detected (lower panel). In G and H, the input represents 1/10th of the total cell lysate (comprising si‐Gal‐3 and NC samples mixed with IgG). All data are presented as the mean ± SD of three independent experiments. *p < 0.05; **p < 0.01; ***p < 0.001.
